Benchmarking Pressing Efficiency for Live Wagers in Promotion Clashes
Written by Vera Franke · Aug 27, 2026
Benchmarking Pressing Efficiency for Live Wagers in Promotion Clashes
Understanding Pressing Efficiency in Modern Football
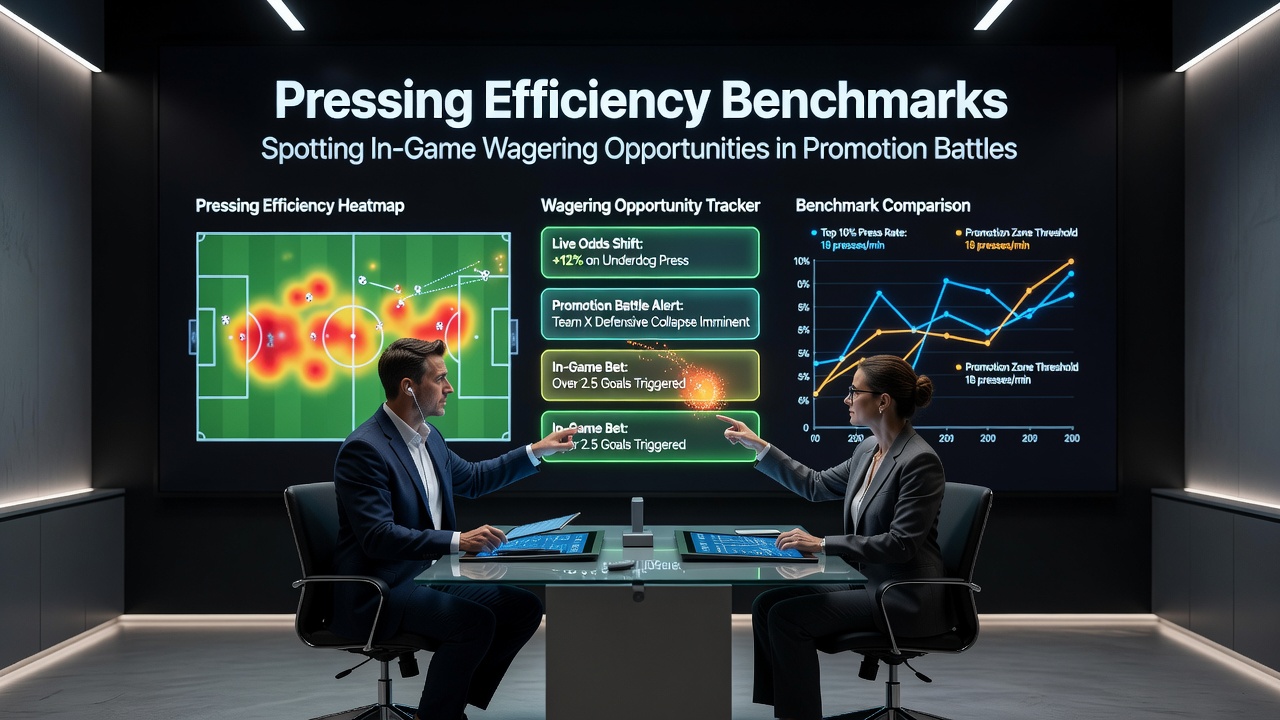
Pressing efficiency measures how effectively teams regain possession in advanced areas through coordinated high-intensity defensive actions, and data providers track this through metrics such as PPDA (passes allowed per defensive action) alongside successful pressure percentages that reach double digits in top European leagues during the 2025-2026 campaign. Researchers at institutions like the International Centre for Sports Studies have compiled season-long datasets showing that sides maintaining PPDA values below 10.5 often sustain longer spells of territorial dominance, which creates measurable shifts in live odds during promotion encounters. Observers note that these benchmarks become particularly relevant when teams enter the final third of the season locked in points battles, where small improvements in recovery speed translate into immediate changes in expected goal differentials.
Key Benchmarks and Their Application
Teams that post pressing success rates above 32 percent in the opposition half generate turnovers that lead to shots within six seconds on average, according to aggregated figures from multiple analytics platforms. This pattern holds across Championship promotion contenders where matches frequently feature narrow scorelines and late momentum swings. Data indicates clubs employing structured high presses reduce opponent build-up completion rates by 18 to 22 percent compared to mid-table sides, producing clear windows for in-play bettors to assess live value once the first 15 minutes reveal whether a press is landing or being bypassed. Those who've studied match logs find that August 2026 pre-season friendlies already displayed early signals of which newly promoted or reinforced squads carried efficient pressing structures into the regular campaign.
Identifying In-Game Wagering Windows
Live betting opportunities surface when pressing metrics diverge from pre-match expectations, such as when a favored side records only 24 percent pressure success in the opening quarter despite fielding a high line. Bettors monitor real-time feeds that flag rising PPDA numbers or declining recovery height, then place wagers on the opposing team to exploit space behind a tiring press. One study of last season's promotion fixtures revealed that matches featuring sustained efficiency gaps above 8 percentage points produced over 1.4 goals after the 60-minute mark on average, creating repeatable entry points for under or over markets. Analysts tracking these trends emphasize that the timing of press triggers, rather than raw volume, determines whether a team maintains or loses control.
Promotion Battle Dynamics and Data Patterns
Promotion clashes often unfold at elevated tempo because both sides recognize the value of three points in tight tables, and pressing efficiency data helps separate sustainable intensity from early exhaustion. Figures reveal that sides maintaining recovery rates above 35 percent in the middle third through the 75th minute tend to collect more points from games decided by single goals. In August 2026, several midweek fixtures already illustrated this when teams that adjusted their press shape at half-time reversed expected goal trends and shifted live accumulator lines noticeably within ten minutes of the restart. External reports from organizations such as CIES Football Observatory confirm that structured pressing correlates with improved results in congested fixtures, though the effect size varies by squad depth and fixture congestion.
Case Examples from Recent Seasons
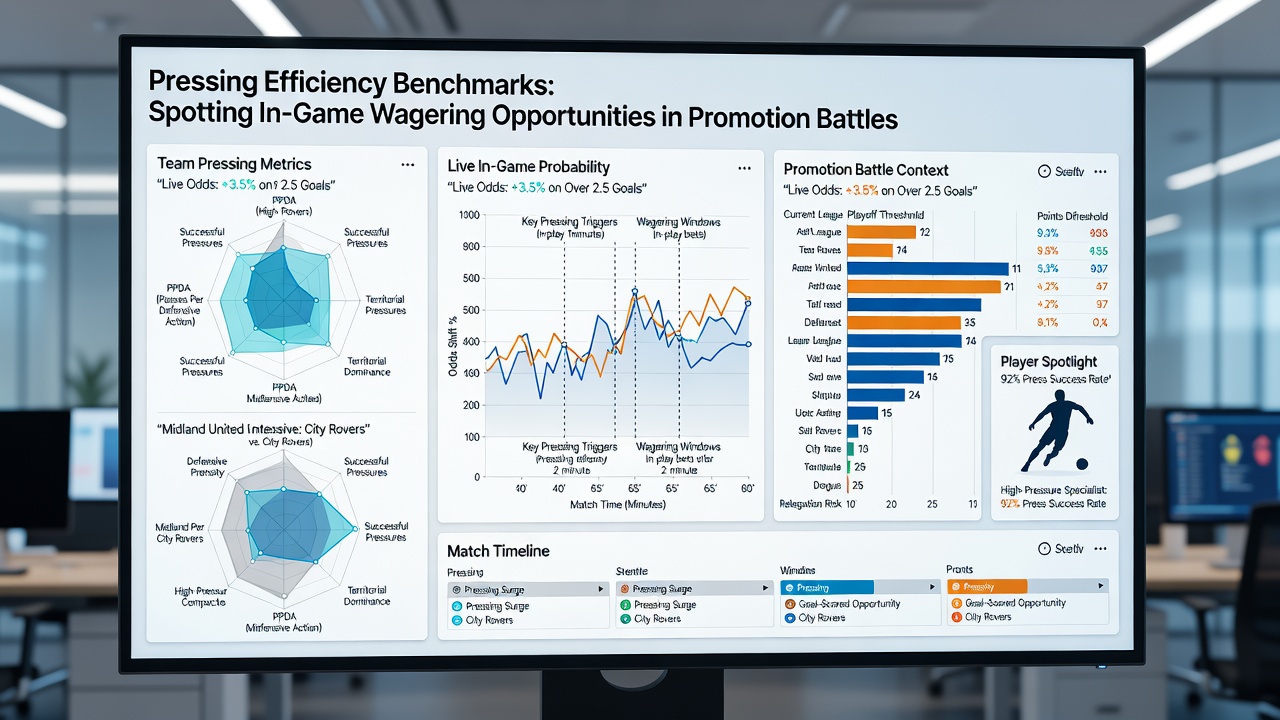
Take one mid-table side that entered a six-pointer with a season PPDA of 9.8 yet allowed 14 passes per defensive action in the first half; the live market responded by shortening the price on the opponent to find the next goal. Those monitoring recovery height noticed the press dropping five meters deeper after the 55th minute, opening channels for through balls that cash accumulators built around late goals. Another example involves a promotion hopeful whose pressing efficiency spiked after a tactical substitution, lifting pressure success from 28 to 41 percent and triggering a cascade of turnovers that reshaped in-play betting lines within a single passage of play. Observers tracking these adjustments note that the speed of metric shifts, rather than absolute values, often signals the strongest wagering edges.
Integrating Multiple Data Streams
Comprehensive analysis combines pressing benchmarks with secondary indicators such as progressive pass completion after turnovers and distance covered in the final 15 minutes. Research from sports performance groups shows that teams sustaining high press intensity while keeping progressive pass accuracy above 78 percent create compounding advantages that live bettors can exploit through goal-line or next-team-to-score markets. During promotion battles the margins remain narrow, so even modest efficiency drops of 4 to 6 percent produce outsized movements in in-play pricing. August 2026 fixtures have already supplied early datasets confirming that sides entering the season with refined pressing structures carry those advantages into competitive windows where points carry extra weight.
Conclusion
Pressing efficiency benchmarks supply objective signals that help identify when live wagering opportunities arise in promotion contests. By following metrics such as PPDA, pressure success rate, and recovery height, analysts and bettors alike observe patterns that align with shifts in match control and scoring probability. Data compiled across recent campaigns demonstrates consistent relationships between sustained pressing performance and late-game outcomes, while August 2026 observations continue to reinforce the value of real-time metric monitoring. These benchmarks therefore function as practical tools for navigating the fluid odds environment that characterizes promotion battles.