Fixture Congestion Patterns and Their Influence on Recovery Metrics Alongside Accumulator Trends in Top Divisions
Written by Bianca Schwarz · Aug 24, 2026
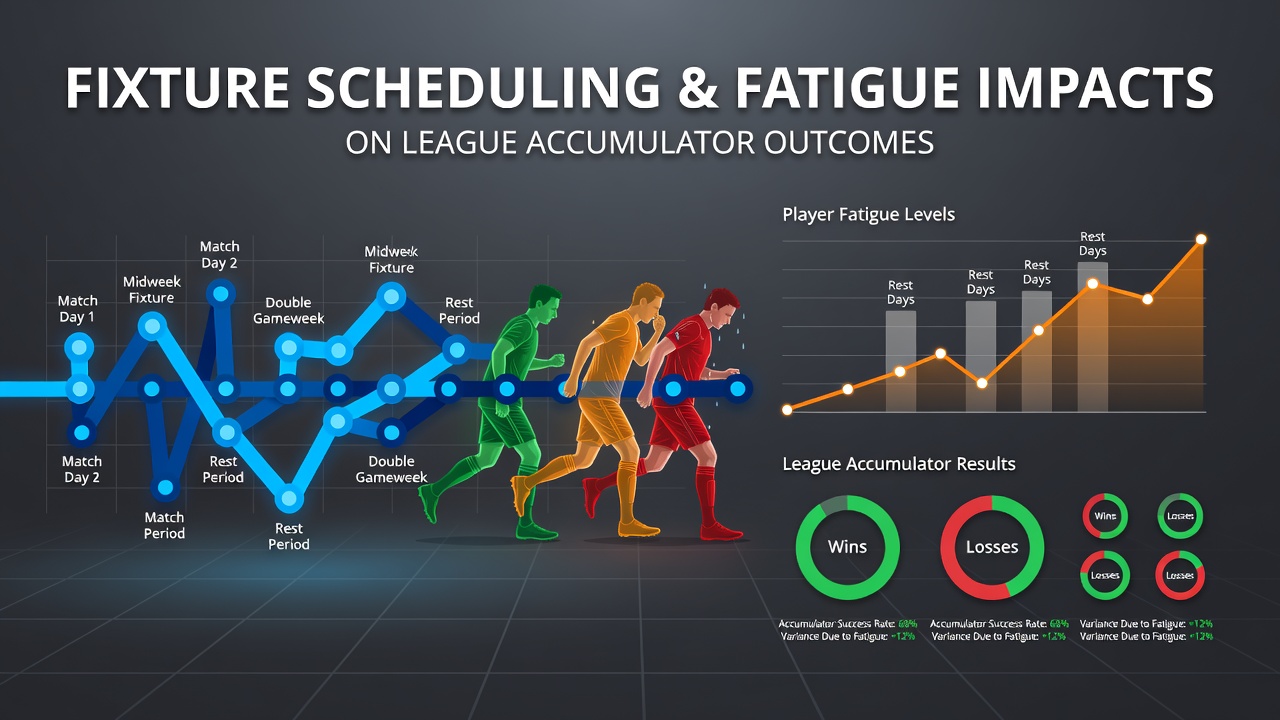
Fixture Congestion Patterns and Their Influence on Recovery Metrics Alongside Accumulator Trends in Top Divisions
League calendars pack matches into tight windows each season, and data from multiple European divisions tracks how these clusters elevate physical demands on squads. Researchers at institutions such as the Australian Institute of Sport have documented increased muscle soreness and reduced sprint capacity after sequences of three games in nine days, while similar patterns appear in domestic and European competitions. August 2026 marks the start of another campaign where clubs face early double-headers because of expanded continental ties, and analysts note that recovery protocols now incorporate GPS monitoring to quantify load spikes.
Understanding Congested Periods Across Competitions
Premier League sides often encounter eight fixtures within 30 days during autumn and winter blocks, whereas Bundesliga schedules distribute rest more evenly yet still create bottlenecks around international breaks. Studies published in the European Journal of Sport Science indicate that total distance covered drops by an average of 5 percent in the second match of a double weekend, and heart rate recovery slows measurably when players log over 600 minutes across two weeks. Teams that rotate personnel more aggressively maintain higher output levels, according to match-tracking statistics released by league authorities.
Measured Effects on Player Physiology and Injury Rates
Medical staff record elevated creatine kinase levels following rapid turnaround games, and soft-tissue injuries rise during periods when clubs play every three days. One analysis covering five seasons across five leagues found hamstring complaints increase 18 percent after midweek European matches followed by league fixtures, and substitute usage patterns shift toward earlier changes to preserve key personnel. Data collected through wearable technology shows sleep duration declines when travel exceeds 500 kilometers between venues, and clubs with deeper benches report fewer absences in the subsequent month.
Downstream Influence on Match Results and Betting Markets
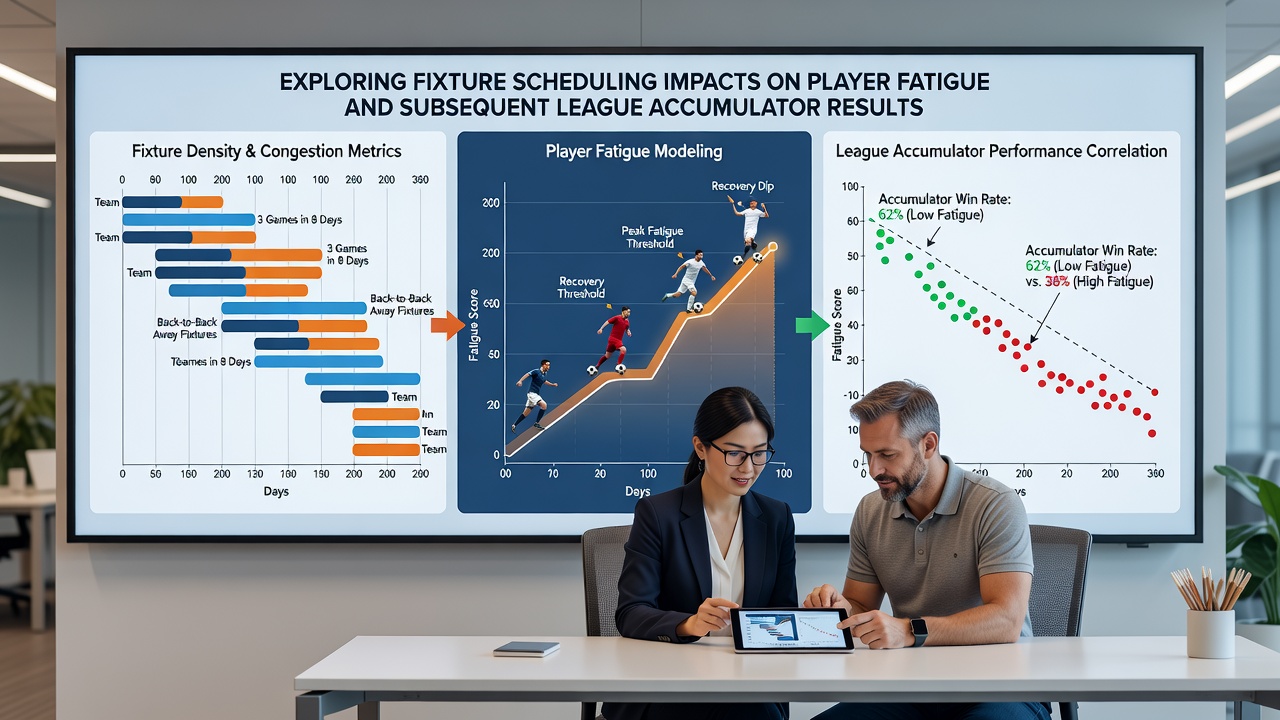
Accumulator selections built on multiple outcomes become sensitive to these scheduling variables because fatigued squads produce fewer clean sheets and altered goal tallies. Historical datasets reveal that teams contesting midweek ties cover less high-intensity distance in the following league game, leading to higher draw percentages in certain fixtures. Operators track these trends through performance indices that factor minutes played by starters, and bettors who incorporate rest-day differentials into their selections adjust stake allocations accordingly. League tables compiled after congested windows show mid-table clubs gaining or losing ground depending on squad depth rather than form alone.
Case Examples From Recent Campaigns
During the 2024-2025 winter period several clubs played five matches in 15 days, and goal-scoring rates dipped while set-piece conversion climbed because open-play creativity declined under fatigue. One study of Championship sides found that those returning from European duty recorded lower pass completion in the opening 30 minutes of their next domestic outing, altering expected points calculations used by modeling teams. Observers note that late-season pile-ups in May create similar distortions, with promotion and relegation issues sometimes hinging on which sides secure longer recovery windows.
Strategic Adjustments by Clubs and Data Providers
Coaching staffs now employ periodization plans that front-load lighter sessions after congested blocks, and nutrition timing receives greater emphasis to accelerate glycogen replenishment. Data providers supply updated metrics on player availability that incorporate travel and previous workload, allowing more granular assessments of probable lineups. Those who follow these indicators adjust accumulator structures to favor sides with favorable schedules over those entering the weekend on shorter rest cycles.
Conclusion
Fixture density continues to shape both on-pitch performance and downstream market behavior in measurable ways, with physiological data and result trends providing consistent signals across multiple seasons. As calendars evolve with new competition formats, ongoing monitoring of load management and recovery metrics supplies the factual basis for understanding how these elements interact in league environments.