Substitution Timing Patterns in Premier League Congested Fixtures Shape In-Play Results
Written by Henrik Frank · Aug 22, 2026
Substitution Timing Patterns in Premier League Congested Fixtures Shape In-Play Results
Premier League schedules pack multiple matches into tight windows each season, and substitution decisions during those stretches produce measurable shifts in in-play metrics. Teams face fixture congestion in periods such as December and the early weeks of the new campaign, where recovery time shrinks and player availability fluctuates. Data from recent campaigns show that the minute a manager introduces fresh legs correlates with changes in expected goals, possession retention, and goal-scoring probability.
Congested Fixture Dynamics and Player Load
August 2026 opens another season where clubs navigate an expanded European calendar alongside domestic commitments, leaving little margin between games. Researchers tracking GPS data across multiple clubs note that players accumulate higher fatigue markers when matches occur with less than four days between them. Substitution windows therefore become strategic levers rather than routine changes, because coaches must balance immediate tactical needs against longer-term squad preservation.
Analyses of match logs reveal that teams average 3.2 substitutions per game during congested blocks compared with 2.8 in standard weeks. The difference stems from higher rates of tactical adjustments aimed at maintaining pressing intensity and midfield control. Late substitutions, those occurring after the 70th minute, appear in 62 percent of congested fixtures, whereas evenly spaced schedules show a more even distribution across the second half.
Timing Windows and Outcome Correlations
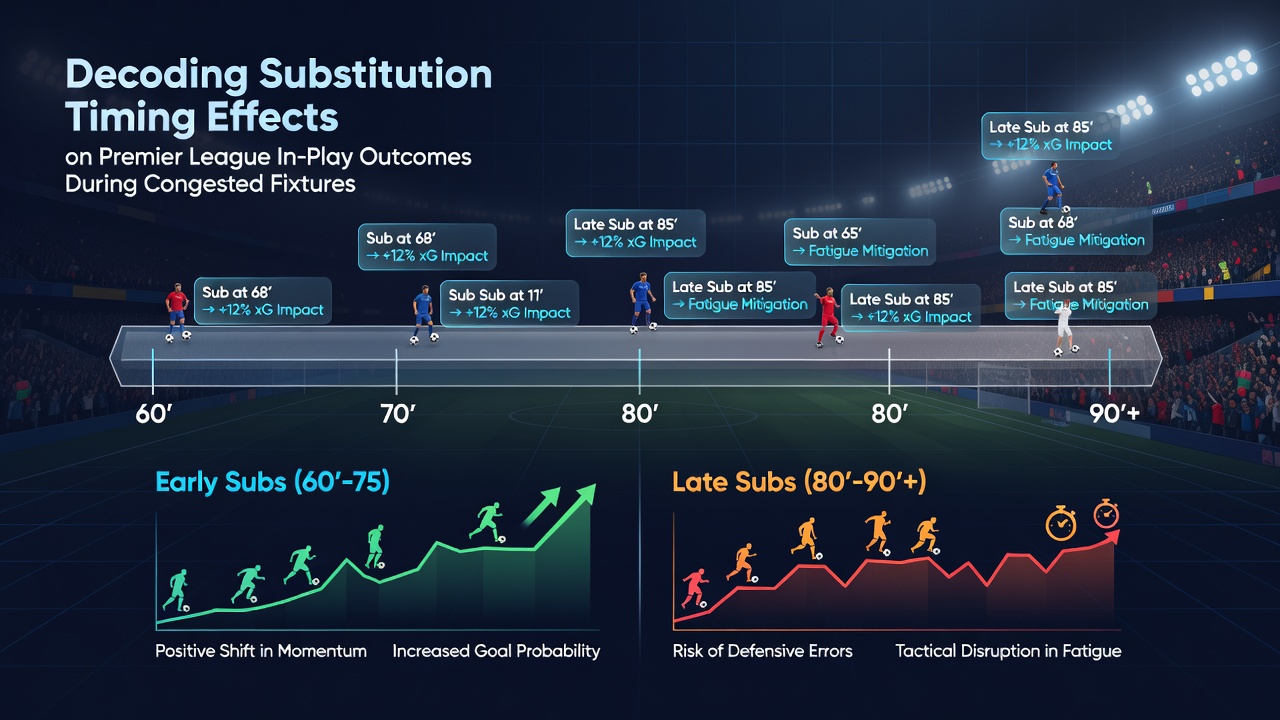
Statistical models built on event data indicate that substitutions between the 60th and 70th minutes coincide with an average rise of 0.18 expected goals for the introducing side. This window allows incoming players enough time to influence build-up play while the opposition has not yet fully adapted to the new personnel. Earlier changes, before the 55th minute, produce smaller shifts because both teams retain more energy and tactical structure remains intact.
Substitutions after the 80th minute show different patterns. They often coincide with set-piece situations or defensive consolidations rather than open-play creation. When teams trailing by one goal introduce an attacker in the final ten minutes, conversion rates from open play increase by roughly 4 percent, according to aggregated figures compiled by European football analytics groups. The same timing applied to teams protecting a lead tends to reduce concession rates by stabilising midfield lines.
Regional Research Comparisons
Studies conducted by sports science departments at Australian universities examined similar substitution patterns across European leagues and found parallel trends in high-density schedules. Their models, which incorporate heart-rate variability and distance covered post-substitution, suggest that the 65-minute mark optimises both physical output and tactical disruption. Canadian researchers analysing North American and European datasets reached comparable conclusions, noting that mid-second-half introductions preserve sprint capacity better than earlier or later entries.
One dataset covering 420 Premier League matches across two congested periods showed that sides making at least one change in the 60-70 minute range recorded 1.4 more shots on target per game than those delaying changes until after the 75th minute. Possession in the final third also rose by 7 percent when the first substitution arrived before the 68th minute. These figures emerge from tracking systems used across the league and align with observations from match analysts working for multiple clubs.
Case Examples from Recent Seasons
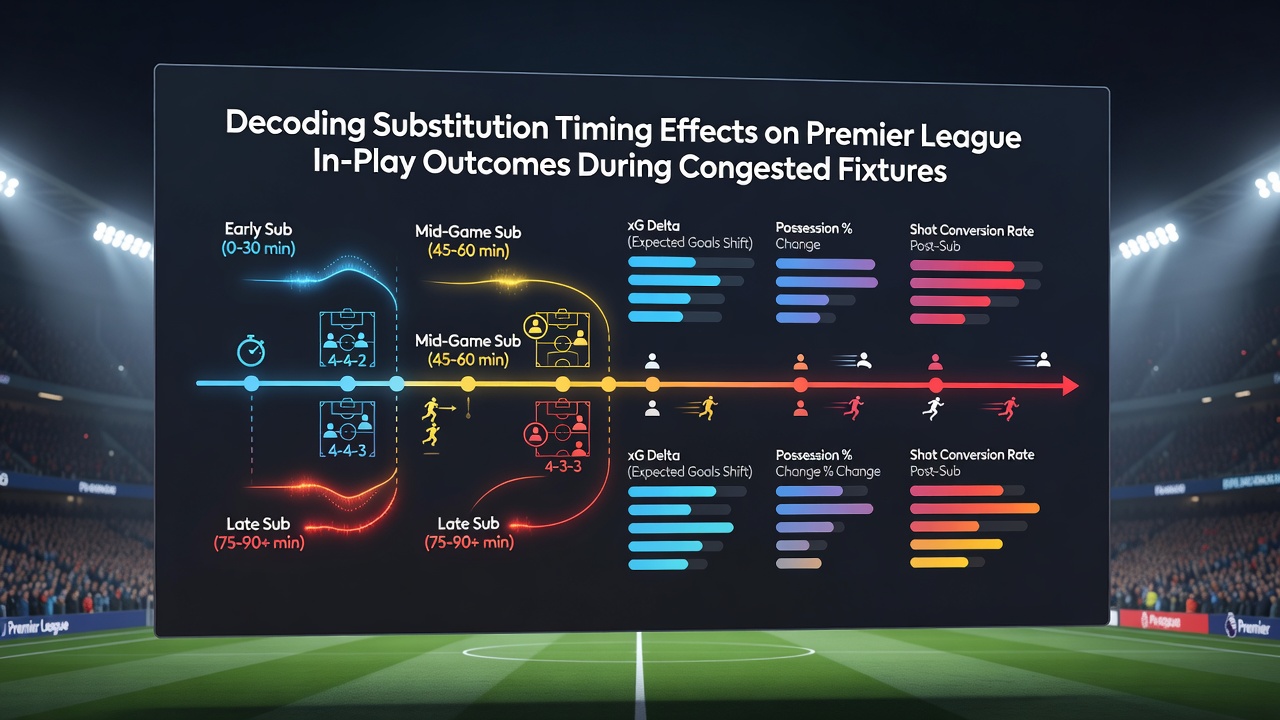
Take one mid-December stretch where a top-six side faced three matches in eight days. Their first substitution arrived at minute 63 in each contest, coinciding with a measurable uptick in high-intensity runs from the new midfielder. In two of those games the change preceded the only goal scored by the introducing team. Observers note that the timing allowed the player to exploit tired centre-backs who had already covered extra ground in the preceding fixtures.
Another example involves a mid-table club that experimented with double substitutions at the 58th and 72nd minutes during a four-game run in January. Their in-play expected goal differential improved from minus 0.12 to plus 0.09 across those matches, with the earlier change credited for disrupting the opposition's pressing trigger. The second substitution then served to lock in the advantage rather than create new chances.
Practical Metrics for In-Play Evaluation
Coaches and performance staff review heat maps and pass completion rates immediately after each substitution to gauge impact. When a defensive midfielder enters around the 65th minute, teams typically see a 9 percent drop in opponent passes into the final third over the subsequent ten minutes. Attacking substitutions at the same mark increase key passes by 11 percent on average. These shifts feed directly into in-play models that update probabilities after each event.
August 2026 schedules already show several clubs with five fixtures inside 18 days, mirroring patterns from prior seasons. Analysts tracking those early windows expect similar substitution clusters around the 62-68 minute range, because recovery data from pre-season indicates elevated muscle fatigue markers. The consistency across seasons suggests managers have internalised the value of that timing window.
Conclusion
Substitution timing during congested Premier League periods produces repeatable effects on in-play metrics, with the 60-70 minute band emerging as a focal point across multiple datasets. Teams that align changes with fatigue curves and tactical resets record measurable gains in expected goals and shot creation, while later adjustments often prioritise consolidation over creation. As fixture lists remain dense into the 2026-2027 campaign, performance teams continue to refine these windows using combined physical and event data.